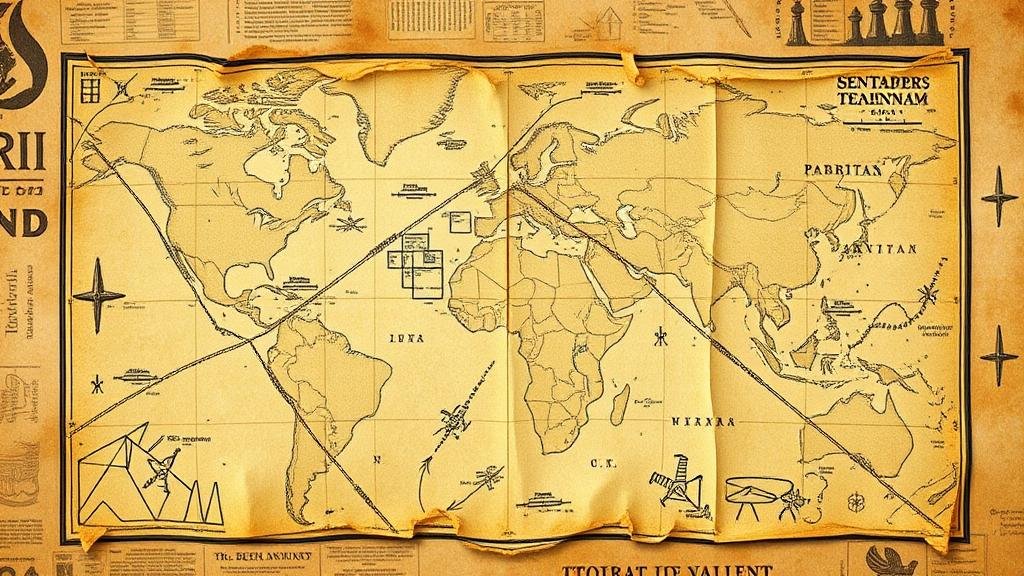
Interpreting Cryptic Notes and Pictographs Found in Map Margins
Understanding Cryptic Notes and Pictographs in Map Margins
Maps have long been revered not only as navigational tools but also as repositories of cultural and historical context. One fascinating aspect of maps is the cryptic notes and pictographs often found in their margins. This article delves into the interpretation of these graphical and textual elements, examining their significance and application in cartography.
The Role of Marginalia in Cartography
Marginalia refers to the annotations, drawings, and symbols found in the margins of maps. e elements serve various purposes, from providing navigational insights to conveying cultural narratives. Historically, margin notes have included:
- Geographical annotations, such as Here be dragons, which served to caution explorers about uncharted territories.
- Symbols indicating land ownership or the locations of resources, crucial for trade and settlement.
- Illustrations that depict local flora, fauna, or significant historical events, enriching the narrative of the region.
For example, in medieval maps, the use of dragons or other mythological creatures was not simply decorative; it often reflected the fears and uncertainties of the era regarding unknown regions. Such elements thus offer a window into the cultural psyche of a time period.
Types of Symbols and Their Meanings
Interpreting cryptic notes and pictographs requires a keen understanding of the symbols cultural and historical context. Common types of symbols include:
- Pictographs: Illustrative symbols that represent objects or ideas. For example, a drawing of a tree may indicate a forest or a fertile agricultural area.
- Iconic Symbols: These are simplified representations, like a crossed sword to denote a historic battle site or conflict area.
- Written Annotations: Textual notes that provide specific instructions or information, such as “safe harbor†next to a coastal area.
For example, a 16th-century map of the Americas may feature pictographs of indigenous people, animals, and plants, which provide insight into the biodiversity and cultural interactions present at that time. Each of these symbols holds a layered meaning that can reveal critical information regarding the people and the environment of the mapped area.
Historical Context and Case Studies
To interpret these notes and pictographs effectively, one must consider the historical context in which the map was created. A case study of a notable historical map is the Tabula Rogeriana, created by the Arab geographer Muhammad al-Idrisi in 1154. This map features rich marginalia, including notes on trade routes and native tribes, illustrating the mingling of science and storytelling in medieval cartography.
Another significant example is the Vinland Map, which suggests the existence of a Norse settlement in America long before Columbus. The cryptic notes in the margins provide directions and descriptions of the land, further asserting the notion that these annotations were valuable for navigational purposes as well as for establishing claims over territories.
Interpreting Techniques and Best Practices
Interpreting cryptic notes and pictographs is a multifaceted task that involves several techniques:
- Contextual Analysis: Understanding the historical and geographical context of the map is essential. One should consider the era in which the map was created and the known cultural practices of that time.
- Symbolic Comparison: Comparing the symbols with similar pictographs or written annotations across different maps can provide insight into their meanings.
- Cross-Referencing with Historical Texts: Historical documents or literature from the time can shed light on the significance of certain symbols or notes.
For example, when analyzing a colonial map, researchers may cross-reference it with contemporary diaries or records that describe the depicted lands and their resources. This process not only reveals the meanings behind cryptic notes but also enhances our understanding of historical demographics and economies.
Applications in Modern Cartography and Beyond
The skill of interpreting cryptic notes and pictographs extends beyond historical map analysis. In modern cartography, understanding these visual languages can aid in creating maps that are rich with information. Urban planners, environmental scientists, and educators can all benefit from this knowledge by incorporating elements that reflect local narratives or advocate for cultural heritage.
Also, the principles of interpreting visual language have applications in digital mapping interfaces, where symbols and annotations help guide users through complex spatial data–much like the traditional maps of the past.
Actionable Takeaways
- Engage with historical maps to enhance your understanding of cultural context–a local library or online archive can provide valuable resources.
- Use software or workshops that focus on cartographic symbolism to improve your ability to interpret modern maps.
- Consider the broader historical narratives and human experiences that maps encapsulate; they are as much about people as they are about places.
Interpreting cryptic notes and pictographs found in map margins is not only an academic exercise but also a way to connect with the diverse stories that shape our understanding of geography, culture, and history.


