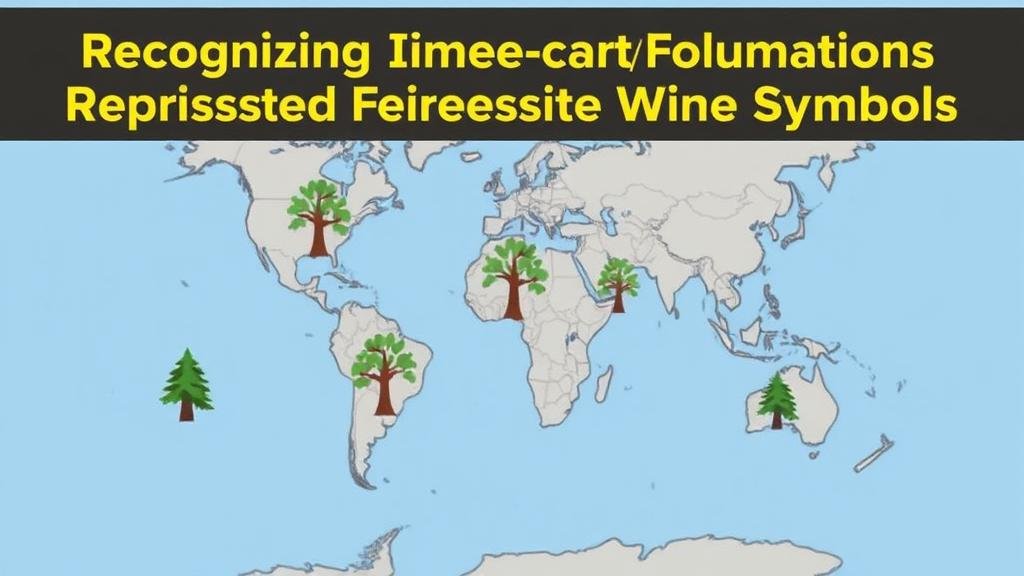
Recognizing Unique Tree Formations Represented in Map Symbols
Understanding Unique Tree Formations Represented in Map Symbols
Map symbols serve as essential tools for conveying complex geographical information in a simplified and accessible manner. Unique tree formations, often represented through various symbols on maps, are crucial for studying biodiversity, forest ecology, and land management practices. This article aims to elucidate the significance of recognizing these unique tree formations and the methodology involved in interpreting their map symbols.
The Importance of Tree Symbol Recognition
Recognizing unique tree formations on maps is fundamental for several reasons:
- Biodiversity Assessment: Tree species diversity indicates the health of an ecosystem. Specific tree symbols can point to the presence of rare or endemic species, crucial for conservation efforts.
- Land Use Planning: Understanding tree formations helps in land management practices, aiding in decisions regarding logging, agriculture, and urban development.
- Ecological Research: Researchers rely on these symbols for analyzing ecosystems, contributing to studies on carbon sequestration, wildlife habitat, and climate change adaptation.
For example, in the Pacific Northwest region of the United States, maps highlighting Douglas Fir and Western Red Cedar trees are vital for forest management teams aiming to maintain the health of local ecosystems while balancing economic interests.
Common Symbols for Tree Formations
Maps typically employ a standardized set of symbols to represent different types of tree formations. Here are some of the commonly used symbols:
- Solid Circle: Generally used to depict individual trees or small groves.
- Clustered Circles: Indicates dense forest areas, often representing mature forests or significant biomass regions.
- Outlined Trees: May signify areas that are subject to logging or areas that have been recently deforested.
- Colored Icons: Different colors can denote specific tree species or health conditions, with red often indicating diseased or dying trees.
Understanding these symbols allows users to decipher the ecological aspects of a given area quickly. For example, a conservationist can recognize a mapped region marked with clustered circles as a critical habitat zone due to its dense forest, prompting further examination of species present there.
Challenges in Interpretation
While map symbols provide significant benefits, challenges remain in accurately interpreting them:
- Variability in Symbol Design: Different mapping organizations may use varying symbols or colors, leading to potential confusion.
- Scale and Detail: The level of detail on a map can obscure complex formations; thus, small-scale maps may not accurately reflect tree diversity.
- Contextual Understanding: A lack of local ecological knowledge may hinder interpretation, making it imperative for users to seek supplementary information.
For example, a land surveyor analyzing a regional map may find that the dense tree clusters do not exist in reality, as they were an artifact of the mapping scale, leading to misguided decisions regarding land use.
Real-world Applications
Understanding unique tree formations through their map symbols plays a vital role in multiple sectors, including:
- Environmental Policy Making: Government bodies utilize tree formation maps to draft policies on environmental protection and sustainable forestry.
- Urban Development: City planners depend on such maps to make informed decisions about green space allocation and urban forestry strategies.
- Educational Resources: Schools and universities use maps featuring tree formations in environmental science curricula to teach students about biodiversity and conservation.
For example, the city of Portland, Oregon, employs mapping systems to identify tree canopies, informing efforts to enhance urban forest cover and mitigate urban heat island effects.
Actionable Takeaways
To effectively recognize and utilize unique tree formations represented in map symbols, consider the following actions:
- Familiarize yourself with various mapping standards and symbology to enhance interpretation skills.
- Incorporate local ecological knowledge and consult experts when analyzing forest maps.
- Stay informed about ongoing research and innovations in mapping technology that can improve accuracy and detail.
To wrap up, recognizing unique tree formations through their map symbols is a pivotal skill across various disciplines. Improved understanding can lead to better biodiversity conservation, effective land management, and enhanced environmental policy-making. By mastering these symbols, individuals and organizations can contribute positively to ecological sustainability and informed decision-making.


