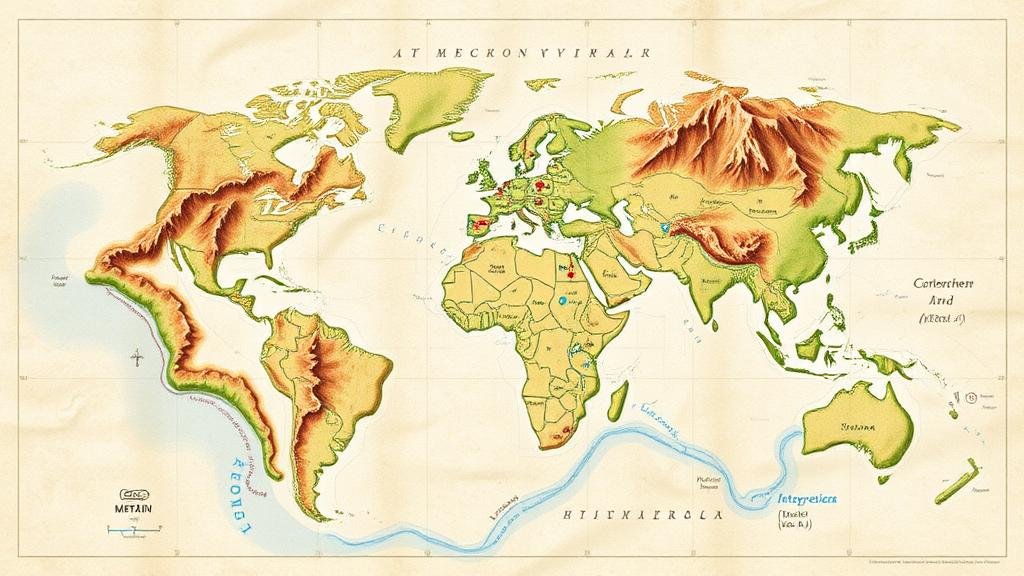
Interpreting Maps With Symbolic Land Features Like Rivers and Peaks
Interpreting Maps With Symbolic Land Features Like Rivers and Peaks
Maps serve as vital tools in geography and navigation, allowing us to visualize and interpret the world around us. Among the various elements depicted on maps, symbolic land features such as rivers and peaks play a crucial role in conveying geographic information. This article will explore the interpretation of maps with a focus on these symbolic land features, delving into their significance, representation, and the methodologies employed in their analysis.
The Importance of Symbolic Features
Symbolic features on a map provide essential context for understanding the physical landscape. Rivers and peaks not only signify natural formations but also influence human activity and settlement patterns. For example, rivers often serve as water sources, transport routes, and boundaries, while peaks can indicate potential for recreation, resource extraction, or climate variation.
- Rivers: These flowing bodies of water are represented by blue lines on most maps. They can indicate the direction of flow and catchment areas.
- Peaks: Typically represented with triangle or dot symbols, peaks signify elevation changes and often highlight important ecological zones.
Maps employ various techniques for highlighting rivers and peaks, using specific symbols and notations that communicate essential geographic information. Understanding these symbols is crucial for accurate interpretation.
- Contouring: Peaks are often indicated using contour lines, which represent elevation at regular intervals. For example, a line value of 2000 feet shows where the land rises to that height, allowing users to ascertain the steepness of terrain.
- Hydrography: Rivers are displayed through blue shaded lines that may vary in thickness to illustrate characteristics such as size or flow rate. Case in point, the Mississippi River appears as a broad line due to its significance as a major waterway.
Case Studies in Interpretation
Interpreting maps involving rivers and peaks can yield invaluable insights into both natural processes and human development. Two significant case studies illustrate these points effectively.
- The Amazon River Basin: This case demonstrates how the symbolic representation of the Amazon River on topographical maps reveals not just the rivers size, but also its impact on the surrounding ecosystems and cultures. The accuracy of the river’s meandering routes aids in environmental planning and resource management.
- The Appalachian Mountains: Maps showing the Appalachian peaks reveal patterns of biodiversity and aid in planning conservation efforts. For example, understanding which peaks serve as migratory pathways for different species highlights areas that require protected status.
Real-World Applications
The ability to interpret maps that feature symbolic rivers and peaks has several real-world applications across different sectors:
- Urban Planning: City planners utilize maps to make informed decisions about zoning, infrastructure development, and environmental protection.
- Environmental Science: Understanding river systems and mountainous terrains can enhance conservation methodologies and guide disaster preparedness in vulnerable regions.
- Tourism Development: Peaks and river systems mapped with clear symbols can assist in promoting tourism by emphasizing natural attractions.
Challenges in Map Interpretation
While maps serve as indispensable resources, several challenges may arise during interpretation:
- Scale Limitations: Maps often depict vast areas in a compact format, making it difficult to identify minor features, such as small streams or isolated hills.
- Symbol Complexity: A poorly designed key or legend may confuse users regarding what specific symbols denote, potentially leading to misinterpretation.
Actionable Takeaways
For effective map interpretation involving rivers and peaks, consider the following strategies:
- Familiarize yourself with common mapping symbols and conventions before engaging in map analysis.
- Use interactive digital maps, which provide real-time data and additional layers, enhancing your understanding of the geographic features.
- Engage in field studies where possible. Observing symbolic features in person can solidify your map-reading skills.
To wrap up, maps that feature symbolic land features such as rivers and peaks are invaluable tools for understanding our environment. By mastering the interpretation of these maps, individuals can enable informed decisions across various fields, from environmental science to urban planning.


